
show#
- EBSDDetectorPlotter.show(legend: bool = False, dimensionless: bool = True, coordinates: Literal['pixel', 'gnomonic'] = 'gnomonic', **kwargs: Any) tuple[Figure, VBox | HBox][source]#
Build the interactive figure and return it with its controls.
- Parameters:
- Returns:
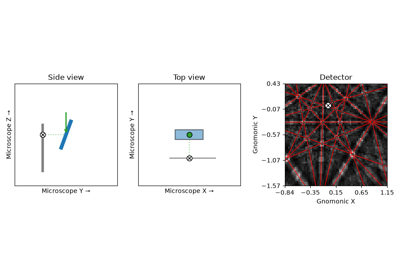
figMatplotlib figure containing the three-panel plot.
controlsWidget box containing the slider controls. Display with
IPython.display.display(controls)alongside fig in a Jupyter notebook.
Notes
Requires
ipywidgets. Ifpsygnalis installed and the detector was not deep-copied (inplace=True), the side and top views are also driven by signals emitted from the detector properties.