
plot_side_view#
- EBSDDetector.plot_side_view(ax: maxes.Axes | None = None, legend: bool = False, dimensionless: bool = True, return_figure: Literal[False] = False, **kwargs) None[source]#
- EBSDDetector.plot_side_view(ax: maxes.Axes | None = None, legend: bool = False, dimensionless: bool = True, return_figure: Literal[True] = True, **kwargs) mfigure.Figure | mfigure.SubFigure
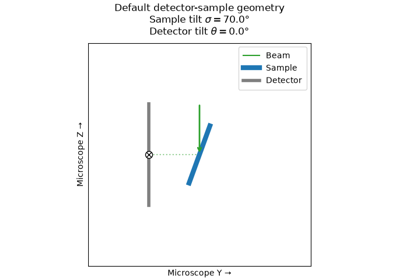
Plot the EBSD detector-sample geometry in a 2D side-view.
The side is viewed along the negative microscope X \(X_m\) axis and shows the Y-Z plane. Changes to the following attributes are visible in this view:
The
EBSDDetectorPlotterprovides an interactive side view.- Parameters:
- ax
The Matplotlib axis to plot in. If not given, a new figure and axis are created.
- legend
Whether to show a legend in the upper right corner. Default is False.
- dimensionless
Whether to ignore the
px_sizewhen drawing the plot axes. Default is True.- return_figure
Whether to return the figure. Default is False.
- **kwargs
Keyword arguments passed to
figure()if ax is not given.
- Returns:
figFigure showing the detector-sample geometry.
See also