
plot_pattern_positions_in_map#
- kikuchipy.draw.plot_pattern_positions_in_map(rc: ndarray, roi_shape: tuple, roi_origin: tuple = (0, 0), area_shape: tuple | None = None, roi_image: ndarray | None = None, area_image: ndarray | None = None, axis: Axes | None = None, return_figure: bool = False, color: str | None = 'k') Figure | SubFigure | None[source]#
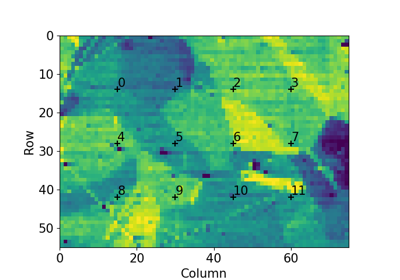
Plot pattern positions in a 2D map within a region of interest (ROI), the ROI potentially within a larger area.
- Parameters:
- rc
Position coordinates (row, column) in an array of shape (n, 2). If
area_shapeis passed, coordinates are assumed to be given with respect to the area origin, and so ifroi_originis passed, the origin is subtracted from the coordinates.- roi_shape
Shape of the ROI as (n rows, n columns).
- roi_origin
Origin (row, column) of the ROI with respect to the area. If this and
area_shapeis passed, the origin is subtracted from therccoordinates.- area_shape
Shape of the area including the ROI as (n rows, n columns). If this and
roi_originis passed, the origin is subtracted from therccoordinates.- roi_image
Image to plot within the ROI, of the same aspect ratio.
- area_image
Image to plot within the area, of the same aspect ratio.
- axis
Existing Matplotlib axis to add the positions to. If not passed, a new figure will be created. If passed, only the coordinate markers and labels are added to the axis. E.g.
roi_imageorarea_imagewill not be used.- return_figure
Whether to return the created figure. Default is
False.- color
Color of position markers and labels. Default is
k. Must be a valid Matplotlib color identifier.
- Returns:
figCreated figure, returned if
return_figure=True.