
adaptive_histogram_equalization#
- VirtualBSEImage.adaptive_histogram_equalization(kernel_size: tuple[int, int] | list[int] | None = None, clip_limit: int | float = 0.0, nbins: int = 128, show_progressbar: bool | None = None, inplace: bool = True, lazy_output: bool | None = None) VirtualBSEImage | LazyVirtualBSEImage | None[source]#
Enhance the local contrast using adaptive histogram equalization.
This method uses
skimage.exposure.equalize_adapthist().- Parameters:
- kernel_size
Shape of contextual regions for adaptive histogram equalization, default is 1/4 of image height and 1/4 of image width.
- clip_limit
Clipping limit, normalized between 0 and 1 (higher values give more contrast). Default is 0.
- nbins
Number of gray bins for histogram (“data range”), default is 128.
- show_progressbar
Whether to show a progressbar. If not given, the value of
hyperspy.api.preferences.General.show_progressbaris used.- inplace
Whether to operate on the current signal or return a new one. Default is True.
- lazy_output
Whether the returned signal is lazy. If not given this follows from the current signal. Can only be True if inplace is False.
- Returns:
s_outEqualized signal, returned if inplace is False. Whether it is lazy is determined from lazy_output.
See also
Notes
It is recommended to perform adaptive histogram equalization only after static and dynamic background corrections of EBSD patterns, otherwise some unwanted darkening towards the edges might occur.
The default window size might not fit all pattern sizes, so it may be necessary to search for the optimal window size.
Examples
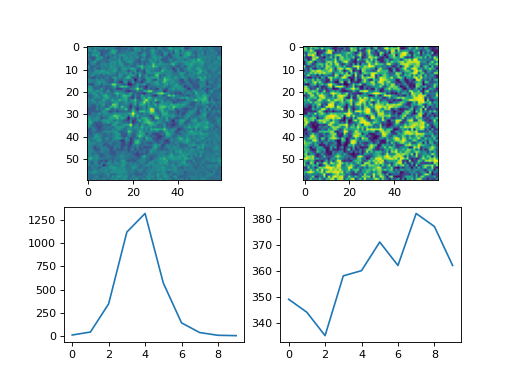
Load one pattern from the small nickel dataset, remove the background and perform adaptive histogram equalization. A copy without equalization is kept for comparison.
>>> import kikuchipy as kp
>>> s = kp.data.nickel_ebsd_small().inav[0, 0]
>>> s.remove_static_background()
>>> s.remove_dynamic_background()
>>> s2 = s.deepcopy()
>>> s2.adaptive_histogram_equalization()
Compute the intensity histograms and plot the patterns and histograms
>>> import numpy as np
>>> import matplotlib.pyplot as plt
>>> hist, _ = np.histogram(s.data, range=(0, 255))
>>> hist2, _ = np.histogram(s2.data, range=(0, 255))
>>> _, ((ax0, ax1), (ax2, ax3)) = plt.subplots(nrows=2, ncols=2)
>>> _ = ax0.imshow(s.data)
>>> _ = ax1.imshow(s2.data)
>>> _ = ax2.plot(hist)
>>> _ = ax3.plot(hist2)