Note
Go to the end to download the full example code
Plot nice master pattern image#
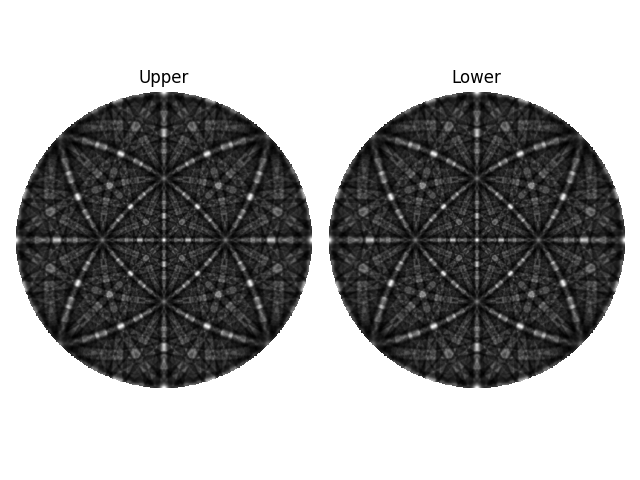
This example shows you how to plot a nice and clean image of an EBSD master pattern. More details are given in the visualization tutorial.

import kikuchipy as kp
import matplotlib.pyplot as plt
import numpy as np


# Load both hemispheres of master pattern in stereographic projection
mp = kp.data.nickel_ebsd_master_pattern_small(hemisphere="both")

# Extract the underlying data of both hemipsheres and mask out the
# surrounding black pixels
data = mp.data.astype("float32")
mask = data[0] == 0
data[:, mask] = np.nan

# Plot both hemispheres with labels
fig, (ax0, ax1) = plt.subplots(ncols=2)
ax0.imshow(data[0], cmap="gray")
ax1.imshow(data[1], cmap="gray")
ax0.axis("off")
ax1.axis("off")
ax0.set_title("Upper")
ax1.set_title("Lower")
fig.tight_layout()
Total running time of the script: (0 minutes 0.606 seconds)
Estimated memory usage: 9 MB