

Note
Go to the end to download the full example code.
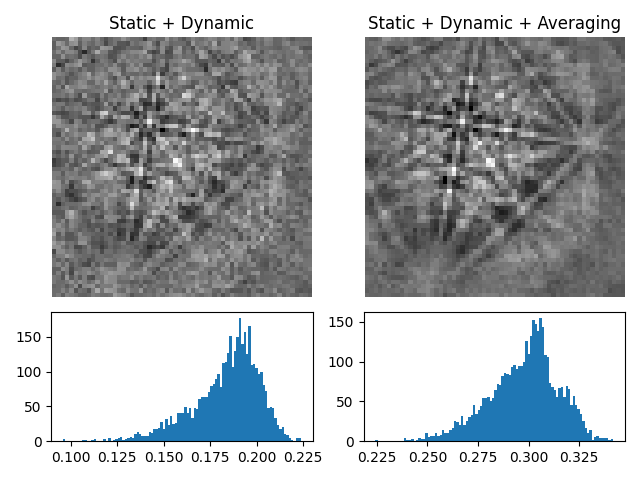
Neighbour pattern averaging#
This example shows how to average each pattern in a scan with its nearest neighbours
using average_neighbour_patterns().
More details are given in the pattern processing tutorial and the feature maps tutorial.
Imports.
import hyperspy.api as hs
import matplotlib.pyplot as plt

import kikuchipy as kp

# Silence progressbars
hs.preferences.General.show_progressbar = False
Load Ni patterns and subtract static and dynamic background.
<EBSD, title: patterns Scan 1, dimensions: (75, 55|60, 60)>
Get image quality before averaging
Keep one pattern for comparison.
Average in a (3, 3) window with a Gaussian kernel with a standard deviation of 1.
s.average_neighbour_patterns(window="gaussian", std=1)

iq1 = s.get_image_quality()
pattern1 = s.inav[x, y]
Plot pattern and histograms of image qualities before and after averaging.
fig, axes = plt.subplots(2, 2, height_ratios=[3, 1.5], layout="tight")
for ax, pattern, title in zip(
    axes[0],
    [pattern0, pattern1],
    ["Static + Dynamic", "Static + Dynamic + Averaging"],
):
    ax.imshow(pattern, cmap="gray")
    ax.set_title(title)
    ax.axis("off")
for ax, iq in zip(axes[1], [iq0, iq1]):
    ax.hist(iq.ravel(), bins=100)
Total running time of the script: (0 minutes 3.443 seconds)