

Note
Go to the end to download the full example code.
Plot nice master pattern image#
This example shows you how to plot a nice and clean image of an EBSD master pattern. More details are given in the visualization tutorial.
Imports.
import matplotlib.pyplot as plt
import numpy as np

import kikuchipy as kp
Load both hemispheres of master pattern in stereographic projection.
mp = kp.data.nickel_ebsd_master_pattern_small(hemisphere="both")
print(mp)
<EBSDMasterPattern, title: ni_mc_mp_20kv_uint8_gzip_opts9, dimensions: (2|401, 401)>
Extract the underlying data of both hemipsheres and mask out the surrounding black pixels.
Plot both hemispheres with labels.
fig, (ax0, ax1) = plt.subplots(ncols=2, layout="tight")
ax0.imshow(data[0], cmap="gray")
ax1.imshow(data[1], cmap="gray")
ax0.axis("off")
ax1.axis("off")
ax0.set_title("Upper")
ax1.set_title("Lower")
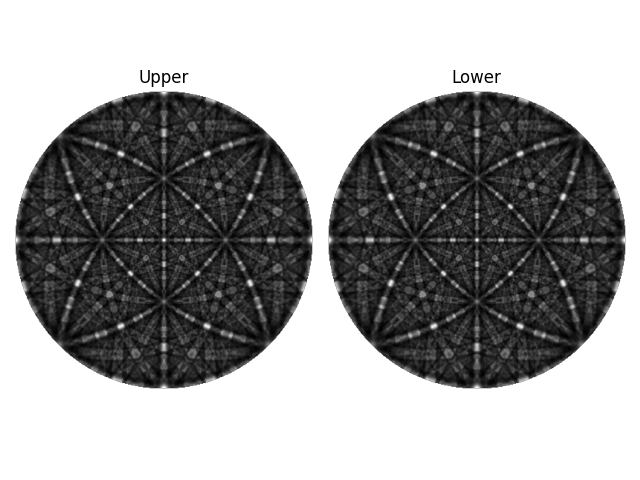
Text(0.5, 1.0, 'Lower')
Total running time of the script: (0 minutes 0.174 seconds)