
estimate_xtilt#
- EBSDDetector.estimate_xtilt(detect_outliers: bool = False, plot: bool = True, degrees: bool = False, return_figure: Literal[False] = False, return_outliers: Literal[False] = False, figure_kwargs: dict | None = None) float[source]#
- EBSDDetector.estimate_xtilt(detect_outliers: bool = False, plot: bool = True, degrees: bool = False, return_figure: Literal[False] = False, return_outliers: Literal[True] = False, figure_kwargs: dict | None = None) tuple[float, ndarray]
- EBSDDetector.estimate_xtilt(detect_outliers: bool = False, plot: Literal[True] = True, degrees: bool = False, return_figure: Literal[True] = False, return_outliers: Literal[False] = False, figure_kwargs: dict | None = None) tuple[float, mfigure.Figure]
- EBSDDetector.estimate_xtilt(detect_outliers: bool = False, plot: Literal[True] = True, degrees: bool = False, return_figure: Literal[True] = False, return_outliers: Literal[True] = False, figure_kwargs: dict | None = None) tuple[float, np.ndarray, mfigure.Figure]
- EBSDDetector.estimate_xtilt(detect_outliers: bool = False, plot: Literal[False] = True, degrees: bool = False, return_figure: Literal[True] = False, return_outliers: Literal[False] = False, figure_kwargs: dict | None = None) float
- EBSDDetector.estimate_xtilt(detect_outliers: bool = False, plot: Literal[False] = True, degrees: bool = False, return_figure: Literal[True] = False, return_outliers: Literal[True] = False, figure_kwargs: dict | None = None) tuple[float, ndarray]
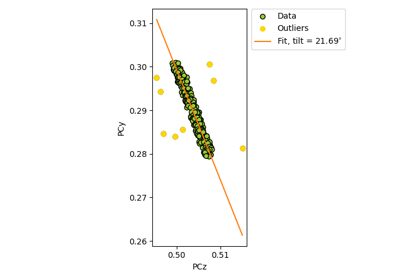
Return an estimate of the tilt about the detector \(X_d\) axis.
The tilt is assumed to bring the sample plane normal into coincidence with the detector plane normal (but in the opposite direction). See [Winkelmann et al., 2020] for further details.
See the reference frame tutorial for details on the detector-sample geometry.
An estimate is found by linear regression of
pczvs.pcy.- Parameters:
- detect_outliers
Whether to attempt to detect outliers. If False (default), a linear fit to all points is performed. If True, a robust fit using the RANSAC algorithm is performed instead, which also detects outliers.
- plot
Whether to plot data points and the estimated line. Default is True.
- degrees
Whether to return the estimated tilt in degrees, radians otherwise.
- return_figure
Whether to return the plotted figure. Default is False.
- return_outliers
Whether to return a mask with True for PC values considered outliers. Default is False. If True, detect_outliers is set to True.
- figure_kwargs
Keyword arguments passed to
matplotlib.pyplot.Figure()if plot is True.
- Returns:
x_tiltEstimated tilt about detector \(X_d\) in radians, unless degrees is True.
outliersReturned if return_outliers is True, in the shape of
navigation_shape.figReturned if plot is True and return_figure is True.
See also
Notes
This method is adapted from Aimo Winkelmann’s function
fit_xtilt()in the xcdskd Python package. See [Winkelmann et al., 2020] for their use of related functions.