
plot#
- EBSDDetector.plot(coordinates: Literal['pixel', 'gnomonic', 'detector'] = 'pixel', show_pc: bool = True, pc_kwargs: dict | None = None, pattern: ndarray | None = None, pattern_kwargs: dict | None = None, draw_gnomonic_circles: bool = False, gnomonic_angles: ndarray | list | None = None, gnomonic_circles_kwargs: dict | None = None, zoom: float = 1.0, return_figure: Literal[False] = False) None[source]#
- EBSDDetector.plot(coordinates: Literal['pixel', 'gnomonic', 'detector'] = 'pixel', show_pc: bool = True, pc_kwargs: dict | None = None, pattern: ndarray | None = None, pattern_kwargs: dict | None = None, draw_gnomonic_circles: bool = False, gnomonic_angles: ndarray | list | None = None, gnomonic_circles_kwargs: dict | None = None, zoom: float = 1.0, return_figure: Literal[True] = False) None | mfigure.Figure | mfigure.SubFigure
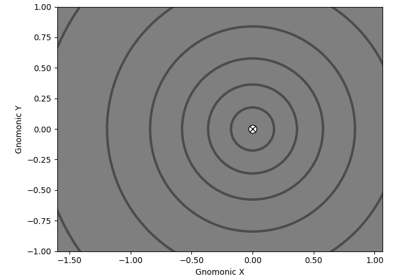
Plot the detector screen viewed from the detector towards the sample.
The plotting of gnomonic circles and general style is adapted from the supplementary material to [Britton et al., 2016] by Aimo Winkelmann.
- Parameters:
- coordinates
Which coordinates to use, “pixel” (default) or “gnomonic”.
Passing “detector” is deprecated and will raise an error in version 0.13.0.
- show_pc
Show the average projection center in the Bruker convention. Default is True.
- pc_kwargs
The following arguments are used:
“s”: PC size. Default is 100.
“zorder”: The z-order. Default is 10.
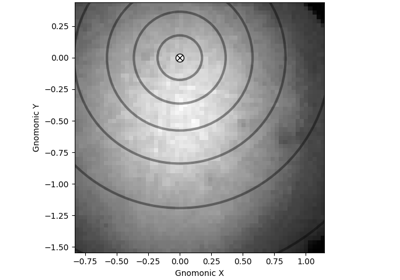
- pattern
A pattern to put on the detector. If not given, no pattern is displayed. The pattern array must have the same shape as the detector.
- pattern_kwargs
Keyword arguments passed to
matplotlib.axes.Axes.imshow().- draw_gnomonic_circles
Draw circles for angular distances from pattern. Default is False. Circle positions are only correct when coordinates are gnomonic.
- gnomonic_angles
Which angular distances to plot if draw_gnomonic_circles is True, in degrees. Default is from 10 to 80 degrees in steps of 10 degrees.
- gnomonic_circles_kwargs
Keyword arguments passed to
matplotlib.patches.Circle().- zoom
Whether to zoom in/out from the detector, e.g. to show the extent of the gnomonic projection circles. Note that a zoom > 1 zooms out. Default is 1 (no zoom).
- return_figure
Whether to return the figure. Default is False.
- Returns:
figMatplotlib figure instance, if return_figure is True.