
plot#
- Window.plot(grid: bool = True, show_values: bool = True, textcolors: list[str] | None = None, cmap: str = 'viridis', cmap_label: str = 'Value', colorbar: bool = True, return_figure: bool = False) Figure | None[source]#
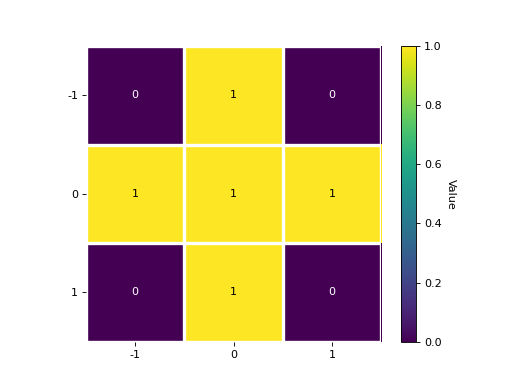
Plot window values with indices relative to the origin.
- Parameters:
- grid
Whether to separate each value with a white spacing in a grid. Default is True.
- show_values
Whether to show values as text in centre of element. Default is True.
- textcolors
A list of two colors. The first is used for values below a threshold, the second for those above. If not given (default), this is set to [“white”, “black”].
- cmap
A colormap to color data with, available in
matplotlib.colors.ListedColormap. Default is “viridis”.- cmap_label
Colormap label. Default is “Value”.
- colorbar
Whether to show the colorbar. Default is True.
- return_figure
Whether to return the figure. Default is False.
- Returns:
figFigure returned if return_figure is True.
Examples
A plot of window data with indices relative to the origin, showing element values and x/y ticks, can be produced and written to file
>>> import kikuchipy as kp
>>> w = kp.filters.Window()
>>> fig = w.plot(return_figure=True)
>>> fig.savefig('my_kernel.png')